Showing posts with label drawing. Show all posts

Saturday, 26 December 2009

drawing graphics for the iPhone (not opengl ES)

Don't we all want to make graphics like this : ?


Well , I'll try to explain how I did this (BTW this graphics comes from my iphone application iSignals).

First create a file in your project which is a subclass of UIView (via XCode>File>New File). Call it for example MyGraphView. 

Then you create a XIB with Interface Builder , in the XIB you add a view and you change the class identity to the custom view class MyGraphView.

And now comes the coding part, lets for the sake of clarity say that you have 2 arrays in MyGraphView (usually you'll pass them via a controller class). These arrays are called datapoints[] and ylabels[].

So let's see how the drawRect method is implemented.

- (void)drawRect:(CGRect)rect {

    // Drawing code


float width =  rect.size.width ;

float height = rect.size.height ;

CGContextRef currentContext ;

int i = 0 ;


 // Get the graphics context that we are currently executing under

currentContext = UIGraphicsGetCurrentContext() ;

   ;


In the first lines of the drawRect, I save the width and the height, I'll use this to calculate the scale factors.

To understand this you need to know a bit of coordinatesystems. The iPhone coordinates are simply the pixels that can be drawn. So for example a view can be 200 px wide and 300 px high.

But of course what more important is , is the world coordinatessystem. And these coordinates are the coordinates of your world.

For example if I want to plot 600 points and the range of those points are between 0.5 and 3.5 then my user coordinatessystem is: X-axis =(0,600) Y-axis  = (0.5,3.5).


So to convert user points into iphone points (or view points) I need to apply a scale factor. The scale factor is calculated as follows.


#define OFFSET_X 30.0f

#define OFFSET_Y 10.0f 


scale_factor_x = ( width -  OFFSET_X ) / ( [dataPoints count] - 0 );

scale_factor_y =   (height - OFFSET_Y ) / (max_y - min_y ) ; // max_y = max(dataPoints) ;min_y = min(dataPoints)


Note: OFFSET_X and OFFSET_Y are 2 constants to let some space in the view where I can are  plot the axes and labels of the axes.


So let's draw the axes , please note that in this first version I don't use CGPath's , later I'll refactor the code and use CGPath's.

And also be aware that I use the default orientation and default location of the origin of the view ( point (0,0) is in the upper left corner).


// draw the axes

CGContextSetRGBStrokeColor(currentContext, 0.83, 0.83, 0.83, 0.7); // this is sort of gray

CGContextMoveToPoint( currentContext,   OFFSET_X, height - OFFSET_Y  );

CGContextAddLineToPoint( currentContext,   OFFSET_X, OFFSET_Y );

CGContextMoveToPoint( currentContext,   OFFSET_X, height - OFFSET_Y   );

CGContextAddLineToPoint( currentContext,   width, height - OFFSET_Y  );

CGContextStrokePath(currentContext);


And draw some gridlines


CGContextSetRGBStrokeColor(currentContext, 0.83, 0.83, 0.83, 1);

CGFloat len[] = {4,2} ;


CGContextSetLineDash( currentContext, 0, len, 2 ) ;

    for ( i = OFFSET_X ; i <= height ; i = i + OFFSET_X )

{

CGContextMoveToPoint( currentContext,   OFFSET_X, height - OFFSET_Y - i );

CGContextAddLineToPoint( currentContext,   width, height - OFFSET_Y - i);

}

CGContextStrokePath(currentContext);


And then draw the graph of datapoints


CGContextSetRGBStrokeColor(currentContext, 1.0, 0.65, 0, 1);

    UIImage *red = [UIImage imageNamed: @"red.png"] ;

UIImage *green = [UIImage imageNamed: @"green.png"] ;

CGPoint aPoint ;

// draw the history graph

for( i = 0 ; i< [dataPoints count] ; i++ )

{

x =  OFFSET_X +    i * scale_factor_x ;

old_y = [[dataPoints objectAtIndex: i]  floatValue];

y =   (height -OFFSET_Y) - ([[dataPoints objectAtIndex: i]  floatValue] - min_y) * scale_factor_y ;


if ( old_x < 0 )

{

CGContextMoveToPoint( currentContext,   x, y  );

old_x = x ;

}

else

{

old_x = x ;

CGContextAddLineToPoint( currentContext,   x, y );

}


}

CGContextStrokePath(currentContext);


And now I show you how to add text in the graph (drawing the Y-labels, I will not give the code for the X-labels).


        // this is for the font

CGContextSetRGBStrokeColor(currentContext, 1, 1, 1, 1);

CGContextSetRGBFillColor(currentContext, 1.0, 1.0, 1.0, 0.8);

CGContextSelectFont(

currentContext,

"Helvetica-Bold",

FONT_SIZE,

kCGEncodingMacRoman

);

        // this transformation is to make sure that the text is written in the right direction

CGAffineTransform transform = CGAffineTransformMake(1.0,0, 0.0, -1.0, 0.0, 0.0);


        CGContextSetTextMatrix(currentContext, transform);

CGContextSetTextDrawingMode(currentContext, kCGTextFill);


// set Y-labels

float j1 = min_y ;

float step = (max_y - min_y)/ 7.0f ; // 7 labels

for ( i = 0.0f ; i <=height ; i = i + OFFSET_X )

{

  // set the precision of the label

if ( j1 > 999.0f )

{

    s1 = [NSString stringWithFormat:@"%4.0f", j1] ;

}

else

{

    s1 = [NSString stringWithFormat:@"%4.2f", j1] ;

}

j1 += step ;

CGContextShowTextAtPoint( currentContext,0 , height - OFFSET_Y - i , [s1 UTF8String] , [s1 length] ) ;


}


CGContextStrokePath(currentContext);


Voila this was it, next time I'll refactor the code and use Paths instead of each time saving and restoring the context


Tuesday, 14 April 2009

Drawing pie charts

Recently I was looking for a way to draw pie charts (you know, the one with an 'exploded' slice) on my Macbook.
Unfortunealy I didn't find much on the Internet, so I've started to experiment a bit myselfs.
The following code draws a pie chart with one slice exploded from the other :

The trick is that you draw an imaginary circle around the center, on this circle is the center of the 'exploded' slice.

#define PI 3.14159265358979323846

NSBezierPath *greenPath = [NSBezierPath bezierPath] ;

// set some line width

[greenPath setLineWidth: 2 ] ;

// move to the center so that we have a closed slice
// size_x and size_y are the height and width of the view

[greenPath moveToPoint: NSMakePoint( size_x/2, size_y/2 ) ] ;

// draw an arc (perc is a certain percentage ; something between 0 and 1
[greenPath appendBezierPathWithArcWithCenter:NSMakePoint( size_x/2, size_y/2) radius:50 startAngle:0 endAngle: 360 * perc ] ;

// close the slice , by drawing a line to the center
[greenPath lineToPoint: NSMakePoint(size_x/2, size_y/2) ] ;
[greenPath stroke] ;

[[NSColor greenColor] set] ;
// and fill it
[greenPath fill] ;

greenPath = [NSBezierPath bezierPath] ;

[[NSColor blackColor] set] ;
[greenPath setLineWidth: 2 ] ;

// draw the second slice, now exploded from the original center

// so to get it exploded I move (10,7) points from the original center
// but on the imaginary circle (thats why the cos and the sin)
// note mide_angle is the angle halve way from the arc, you can experiment with multiple
// angles, note also that the angle is in degrees
[greenPath moveToPoint: NSMakePoint(size_x/2 - 10 * cos ( PI * mid_angle /
180 ) , size_y/2 - 7 * sin ( PI * mid_angle / 180 )) ] ;

// and now draw the other slice
[greenPath appendBezierPathWithArcWithCenter:NSMakePoint( size_x/2 - 10 * cos ( PI * mid_angle / 180 ) , size_y/2 - 7 * sin ( PI * mid_angle / 180 )) radius:50 startAngle:360 * perc endAngle:360 ] ;

// close the slice
[greenPath lineToPoint: NSMakePoint( size_x/2 - 10 * cos ( PI * mid_angle / 180 ) , size_y/2 - 7 * sin ( PI * mid_angle / 180 ) ) ] ;
[greenPath stroke] ;
[[NSColor blueColor] set] ;

[greenPath fill] ;


The result of above code is here :


Next time I'll add some code to add text to the slices

Sunday, 22 March 2009

Drawing in views : background in custom views

Sometimes it could be usefull to have a background image in view instead of a color. For example if we want to have a texture in a view.

In the following example I draw a 'wall' as the background of a view :


The texture I want to apply to my view is the following :


Now its very easy to define this as a texture, you just create a new color , and not just a color but a colorpattern :

Step 1 : find the texture in my resources

NSString* fileName = [[NSBundle mainBundle] pathForResource: @"wall" ofType:@"jpg"];

NSURL* url = [NSURL fileURLWithPath: fileName];

Step 2 : upload the image from the URL
background = [[NSImage alloc] initWithContentsOfURL: url];

Step 3 : define a new color

color = [NSColor colorWithPatternImage:background ] ;
[color set] ;

Step 4 : fill the background
NSRectFill( [self bounds] ) ;

Note that you need to implement this code also in the drawRect: method, to ensure that each time your view get's redrawn that the background is drawn also.

Monday, 2 March 2009

Drawing in views: rectangles

When you want to draw a rectangle (or fill one), you basically have 2 choices :

1. You want absolute performance and less accuracy then you can use the functions defined in NSGraphics.h (NSFrameRect, NSRectFill etc).

2. You need absolute accuracy and don't care so much about performance then you can use the methods defined in NSBezierPath.

(the reason why the NSBezierPath is less performant is explained in this article ).

The following code extract is from a drawRect: method of a custom view :
It shows the different methods of drawing and filling a rectangle.

NSBezierPath *aPath ;

NSBezierPath *myPath ;

// reset the bounds
[self setBounds: NSMakeRect(0,0,1000,1000)] ;

//---------------------------------
//1. filling rectangles
//---------------------------------
[[NSColor grayColor] set] ;

// convenience method for filling a rectangle
// less precise , but good performance
// C functions defined in NSGraphics.h
NSRectFill( rect ) ;

// filling a rectangle using a class method of NSBezierPath
[NSBezierPath fillRect: NSMakeRect( 0,500,75,75) ] ;


// filling a rectangle using an instance method of NSBezierPath
// this usefull if you want to do additional drawing in that path
myPath = [NSBezierPath new] ;
[myPath appendBezierPathWithRect: NSMakeRect ( 600,0,80,80) ] ;
[myPath fill] ;


// -----------------------------
//2. drawing a rectangle
//------------------------------

[[NSColor redColor] set ] ;

// drawing a rectangle using a class method of NSBezierPath
[NSBezierPath strokeRect: NSMakeRect( 500,500,80,80 ) ] ;

// drawing a rectangle using an instance method of NSBezierPath
// this usefull if you want to do additional drawing in that path
[[NSColor greenColor] set ] ;
aPath = [NSBezierPath bezierPathWithRect: NSMakeRect( 450,600,100,100) ] ;
[aPath stroke] ;


// absolute performance, less precise
// C functions defined in NSGraphics.h
NSFrameRectWithWidth( NSMakeRect( 700,700,70,70), 10 ) ;

NSFrameRect( NSMakeRect( 0,700,80,80 ) );

Thursday, 12 February 2009

Drawing in views : how to draw a grid ?

Drawing a grid in a view is rather simple, I do this often to better align my objects.
To draw a grid you can simply add the following lines of code to your drawRect: method :

(GRIDSIZE is a macro defined in the .h file of the view).

- (void)drawRect:(NSRect)rect {
// Drawing code here.
int width = rect.size.width ;
int height = rect.size.height ;

int i = 0 ;

 
// Set the color in the current graphics context for future draw operations
[[NSColor lightGrayColor] setStroke];

// Create our drawing path

NSBezierPath* drawingPath = [NSBezierPath bezierPath];

// Draw a grid
// first the vertical lines
for( i = 0 ; i <= width ; i=i+GRIDSIZE ) { [drawingPath moveToPoint:NSMakePoint(i, 0)]; [drawingPath lineToPoint:NSMakePoint(i, height)]; } // then the horizontal lines
for( i = 0 ; i <= height ; i=i+GRIDSIZE ) { [drawingPath moveToPoint:NSMakePoint(0,i)]; [drawingPath lineToPoint:NSMakePoint(width, i)]; } // actually draw the grid
[drawingPath stroke];


}

Tuesday, 27 January 2009

Drawing in views

For the people lookin for information on how to draw for the iPhone must look here

Drawing in Cocoa is simple (NOT).

In fact each object on the screen can be seen as a view and each view has a method named drawRect: (Rect) that is called each time when a view need to be (re)drawn. For example in the case of a resize, a maximize window etc.

Most people will then use a path to do the actual drawing (by using an instance of the class NSBezierPath).

Now a simple example to show how to draw in Cocoa.

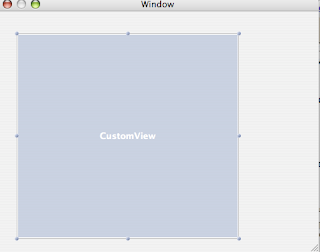
First start a new project and open the Interface Builder. From the controls window , select the 5th item (this contains custom view, image view etc).
Click on custom view and drag it to the window :


Now in XCode you have to define a class which will be associated with this custom view.
You do this by selecting XCode>File>New File, then a popup will show in which you select 'objective-c class subclass NSView'.

Give your new class a name, when you open the .m file you'll see that XCode generated 2 methods : drawRect and initWithFrame.

Now go back to the Interface Builder and drag the .h file from you freshly created class to the MainMenu.nib window. By doing this you have informed the interface builder that their is a new view class.

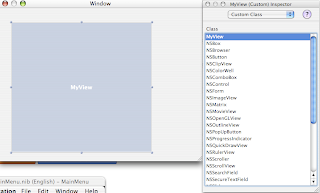
In a last step you have to associate the CustomView with the view class.

You do this by opening an Inspector on the customview and changing the custom class.


So now we are done in the IB, save and close it. And do a build and go.

And you see an empty window, of course because we didn't do anything yet.

To actually draw something you have to implement the drawRect method of your custom view class :

// Drawing code here.

 
// Set the color in the current graphics context for future draw operations
[[NSColor blackColor] setStroke];
[[NSColor yellowColor] setFill];


// Create our drawing path

NSBezierPath* drawingPath = [NSBezierPath bezierPath];

// draw a rectangle

[drawingPath appendBezierPathWithRect: rect];

// actually draw it
[drawingPath stroke] ;

// and fill it
[drawingPath fill] ;


The above source code lines gives an example of what can be in a drawRect method.
What it does is in fact drawing a rectangle and fill it with color yellow.
Now as already said , each time an event happens to a view the drawRect method will be called for each view.

Sometimes we want to draw a grid, some explanation and source code can be found here ,
I also looked at the different ways to draw rectangles.